This paged has moved. You will be redirected to the new Simpsons Index page automatically in 10 seconds. Please bookmark the correct new page at http://www.countrysideinfo.co.uk/simpsons.htm
Simpson's Diversity Index
| Simpson's Diversity Index is a measure of diversity.
In ecology, it is often used to quantify the biodiversity of a habitat. It takes into
account the number of species present, as well as the abundance of each species. The Index of Diversity which AS/A2 level students in the UK need to understand can be found here. Before looking at Simpson's Diversity Index in more detail, it is important to understand the basic concepts outlined below. Biological Diversity - the great variety of life Biological diversity can be quantified in many different ways. The two main factors taken into account when measuring diversity are richness and evenness. Richness is a measure of the number of different kinds of organisms present in a particular area. For example, species richness is the number of different species present. However, diversity depends not only on richness, but also on evenness. Evenness compares the similarity of the population size of each of the species present. 1. Richness The number of species per sample is a measure of richness. The more species present in a sample, the 'richer' the sample. Species richness as a measure on its own takes no account of the number of individuals of each species present. It gives as much weight to those species which have very few individuals as to those which have many individuals. Thus, one daisy has as much influence on the richness of an area as 1000 buttercups. 2. Evenness Evenness is a measure of the relative abundance of the different species making up the richness of an area. To give an example, we might have sampled two different fields for wildflowers. The sample from the first field consists of 300 daisies, 335 dandelions and 365 buttercups. The sample from the second field comprises 20 daisies, 49 dandelions and 931 buttercups (see the table below). Both samples have the same richness (3 species) and the same total number of individuals (1000). However, the first sample has more evenness than the second. This is because the total number of individuals in the sample is quite evenly distributed between the three species. In the second sample, most of the individuals are buttercups, with only a few daisies and dandelions present. Sample 2 is therefore considered to be less diverse than sample 1.
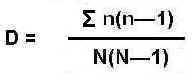
A community dominated by one or two species is considered to be less diverse than one in which several different species have a similar abundance. As species richness and evenness increase, so diversity increases. Simpson's Diversity Index is a measure of diversity which takes into account both richness and evenness. The term 'Simpson's Diversity Index' can actually refer to any one of 3 closely related indices. Simpson's Index (D) measures the probability that two individuals randomly selected from a sample will belong to the same species (or some category other than species). There are two versions of the formula for calculating D. Either is acceptable, but be consistent.
The value of D ranges between 0 and 1 With this index, 0 represents infinite diversity and 1, no diversity. That is, the bigger the value of D, the lower the diversity. This is neither intuitive nor logical, so to get over this problem, D is often subtracted from 1 to give: Simpson's Index of Diversity 1 - D The value of this index also ranges between 0 and 1, but now, the greater the value, the greater the sample diversity. This makes more sense. In this case, the index represents the probability that two individuals randomly selected from a sample will belong to different species. Another way of overcoming the problem of the counter-intuitive nature of Simpson's Index is to take the reciprocal of the Index: Simpson's Reciprocal Index 1 / D The value of this index starts with 1 as the lowest possible figure. This figure would represent a community containing only one species. The higher the value, the greater the diversity. The maximum value is the number of species (or other category being used) in the sample. For example if there are five species in the sample, then the maximum value is 5.
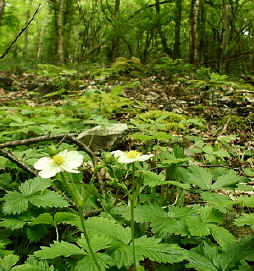
As an example, let us work out the value of D for a single quadrat sample of ground vegetation in a woodland. Of course, sampling only one quadrat would not give you a reliable estimate of the diversity of the ground flora in the wood. Several samples would have to be taken and the data pooled to give a better estimate of overall diversity. How many samples?
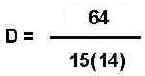
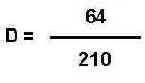
Putting the figures into the formula for Simpson's Index
D = 0.3 (Simpson's Index) Then: Simpson's Index of Diversity 1 - D = 0.7 Simpson's Reciprocal Index 1 / D = 3.3 These 3 different values all represent the same biodiversity. It is therefore important to ascertain which index has actually been used in any comparative studies of diversity. A value of Simpson's Index of 0.7, is not the same as a value of 0.7 for Simpson's Index of Diversity. Simpson's Index gives more weight to the more abundant species in a sample. The addition of rare species to a sample causes only small changes in the value of D.
Ecological Sampling
|
||||||||||||||||||||||||||||||||||||||||||||||