Offwell Wetland Survey
Bar Charts showing
changes in the % cover of individual
plant species along the North/South Belt Transect.
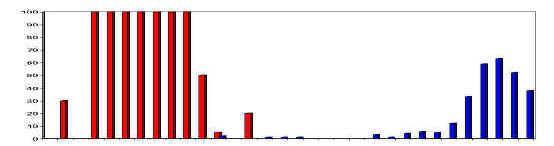
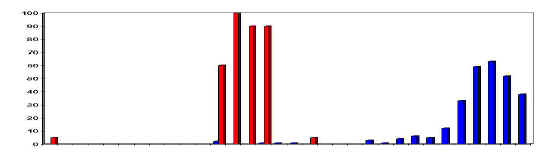
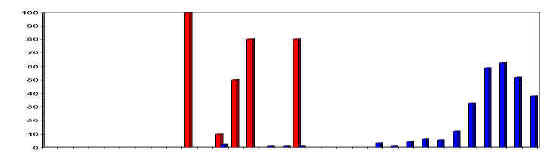
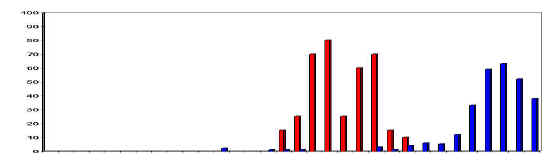
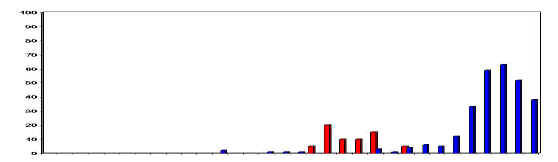
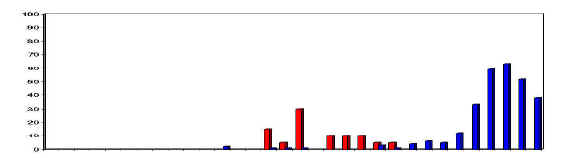
The bar charts below illustrate the distribution of individual plant species along the North/South Belt Transect. The red bars represent the % cover of the plant species in each 1m quadrat along the line. This shows where each species occurred on the line, as well as how much of it there was at each point. The vertical scale is the same for each bar chart. The blue bars in the charts represent the water depth, with maximum depth being 65cm. These bar charts can be directly related to the plant zonation diagrams produced as part of the line transect results. The species colours are co-ordinated between the diagrams and these charts. Comparison of the two illustrates the difference in the type of results obtained using line and belt transect methods. Most species will have an optimum zone within their range where the environmental conditions are best suited to their growth. In the diagrams below, this zone will be indicated by the area where the species reaches its maximum % cover. The percentage cover will often tail off gradually to either side of the optimum zone. It is possible to see this broad pattern in the charts of all the species below, except Alder. The optimum zone for Rhododendron is in the dry land area. As standing water appears in the wetland, the Rhododendron dies out and Soft Rush takes its place. The Soft Rush is very dominant in this region, with a very high % cover. Wood Clubrush, Reedmace and Marsh Bedstraw all occupy the same general area in the marsh, where water depths are low. However it can be seen that Wood Clubrush is more dominant and covers a much greater area than the other two species (the red bars are much taller). Environmental conditions in the different zones are extremely variable locally, as are the water depths. The water depths marked were correct at the time of the survey but they will of course vary with the amount of water entering the wetland from rainfall and run-off. This means that there may be several optimum places for a species in a particular zone (Alder). This can make it difficult to pick out any particular pattern of distribution. |
NORTH |
SOUTH |
|
Rhododendron |
|
|
Soft Rush |
|
|
Alder |
|
|
Wood Clubrush |
|
|
Greater Reedmace |
|
|
Marsh Bedstraw |
|
|