Offwell Wetland Survey
Bar Charts showing changes in
the % cover of selected
plant species along the North/South Belt Transect.
(Continued - Previous)
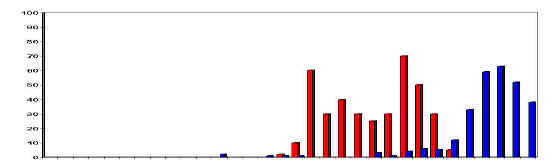
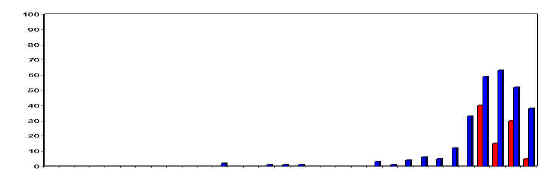
The bar charts below illustrate the distribution of individual plant species along the North/South Belt Transect. The red bars represent the % cover of the plant species in each 1m quadrat along the line. This shows where each species occurred on the line, as well as how much of it there was at each point. The vertical scale is the same for each bar chart. The blue bars in the charts represent the water depth, with maximum depth being 65cm. These bar charts can be directly related to the plant zonation diagrams produced as part of the line transect results. The species colours are co-ordinated between the diagrams and these charts. Comparison of the two illustrates the difference in the type of results obtained using line and belt transect methods. Most species will have an optimum zone within their range where the environmental conditions are best suited to their growth. In the diagrams below, this zone will be indicated by the area where the species reaches its maximum % cover. The percentage cover will often tail off gradually to either side of the optimum zone. Common Duckweed (below) shows this pattern very clearly where it occurs in the shallow water of the swamp area. It is difficult to pick out any similar pattern for the remaining species. This is due to the fact that environmental conditions in the wetland are extremely variable locally, as are the water depths. The water depths marked were correct at the time of the survey but they will of course vary with the amount of water entering the wetland from rainfall and run-off. This means that there may be many optimum places for a species in a particular zone. Yellow Iris and Branched Bur-reed both grow in the same general area. It is evident from matching the charts, that of the two, Yellow Iris dominates, except where the water depth begins to increase substantially. Here, the Bur-reed obviously has an advantage over the Yellow Iris and out competes it. |
| NORTH | SOUTH |
|
Water Mint |
|
|
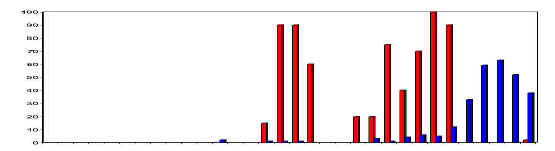
Yellow Iris |
|
|
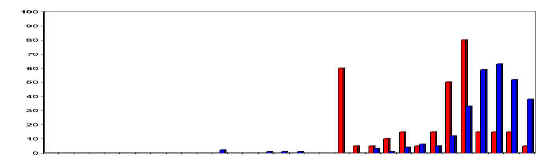
Branched Bur-reed |
|
|
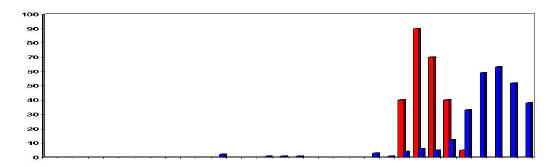
Common Duckweed |
|
|
Canadian Pondweed |
|
|
Plant Zonation Diagram Back to Results