Offwell Wetland Survey
Line Transect Diagrams
|
 |
Line
transect diagrams |
The
transects |
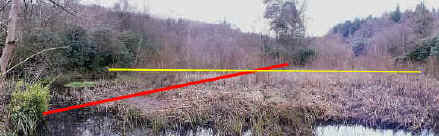
Line transect diagrams are available for both the N/S and E/W transects in the wetland. These diagrams are very detailed and the download times are consequently longer than normal. For suggestions on maximising the benefit of downloading these diagrams click here. Three different diagrams are presented for each of the N/S and E/W transects, depending on how the transect was carried out. The purpose of this was to illustrate the different levels of data obtained when surveying a site using different methods. As a guideline, should you wish to look at only one of the diagrams, the continuous line transect diagrams show the most detail, including all the species occurring in the transect area. Consequently, they have longer download times. The interrupted line transect diagrams (every metre) are less detailed, but show the patterns of plant zonation clearly. The interrupted line transect diagrams (every other metre) are the least detailed, with the shortest download times. However, they may miss out relevant information on the species present. To access the diagrams, click on the links below.
|
| Transect 1 N/S | Transect 2 E/W |
| Download
Time Approx. 2.5 minutes |
Download Time Approx. 2 minutes |
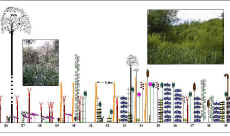
| 2. Similar interrupted
line transect diagrams showing plants touching the line every metre.
|
| Transect 1 N/S | Transect 2 E/W |
| Download
Time Approx. 2 minutes |
Download Time Approx. 1.5 minutes |
| 3. Interrupted line transect diagrams
showing plants touching the line every other metre.
|
| Transect 1 N/S | Transect 2 E/W |
| Download Time Approx. 1.5 minutes |
Download Time Approx. 1 minute |