The Woodland Education Centre
Heathland Project Report
Report Introduction Contents Summary
Species similarity between Sections
 |
 |
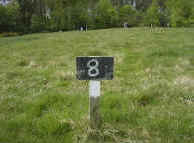 |
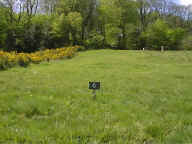
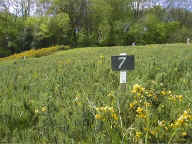
Above: views of strips 6,7 and 8 on the Heathland Restoration site.
The degree of similarity between the vegetation of different sections can be examined by a comparison of indices of similarity, calculated for paired sections (Table below).
1998
1997
Indices of similarity for paired sections in 1997 and 1998
The index of similarity between two sections was calculated using the following formula:
Index of Similarity = 2C
(A + B)
Where A = the number of species in section A
B = the number of species in section B
C = the number of species common to both sections
The closer the index of similarity is to 1, the more similar the sections are.
1996 data was not analysed because many of the species present in 1996 were only identified to genus level. The results would thus not be truly comparable to those obtained in 1997 and 1998. Species numbers obtained from the random data were used to calculate the indices for 1997 and 1998 (Table above). This was done because the belt transect data routinely underestimates the number of species present (Chart) due to the smaller number of samples taken and the narrow band actually sampled.
Comparisons of the indices of similarity for paired sections (Table above) reveals a number of general insights . (Paired sections with highest species similarity are indicated by the indices in bold type)
1) Sections adjacent to each other tend to be the most similar. This is fairly obvious, because species will be able to spread and colonize neighbouring sections more readily. Also, environmental conditions are likely to be more constant between adjacent sections.
2) The vegetation of the sections became more similar in terms of the species present, between 1997 and 1998 (although the amounts of individual species varies considerably, so that sections still look markedly different).
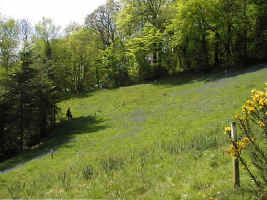
left: sections 1,2,3 and 4.
3) Sections 2 and 4 have become much more similar to each other in the period 1997- 1998. Both sections were also highly similar to section 7. This is likely to be related to the fact that they are all cut in the spring.
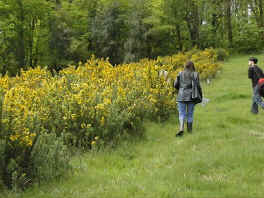
left: the control strip is dominated by tall gorse, here in full yellow flower.
4) The section with the highest similarity to the control section in 1998 was section 7.
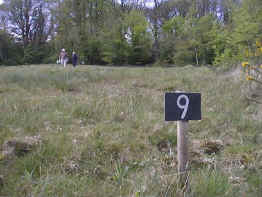
left: strip 9.
5) Sections 1 and 9 had a high similarity to each other in 1998. This is presumably related to the position of these sections, each directly adjacent to woodland.
Continue to the
effects of management - brushcutting on grasses ![]()
| Heathland Restoration Project Report | ||||
Other Lowland
Heaths in East Devon