Offwell Wetland Survey
Changes in the Percentage Cover of Individual Species along the East/West Belt Transect
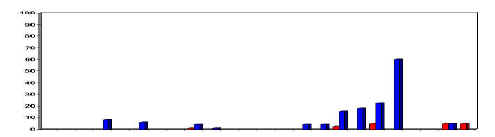
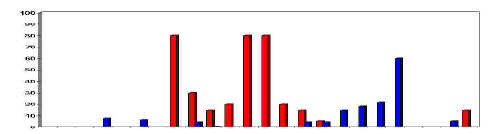
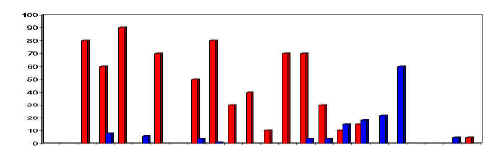
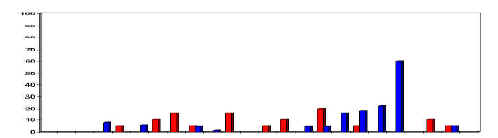
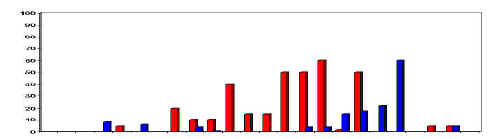
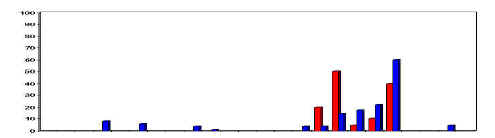
The bar charts below illustrate the distribution of individual plant species along the East/West Belt Transect. The red bars represent the % cover of the plant species in each 1m quadrat along the line. This shows where each species occurred on the line, as well as how much of it there was at each point. The vertical scale is the same for each bar chart. The blue bars in the charts represent the water depth, with maximum depth being 65cm. These bar charts can be directly related to the plant zonation diagrams produced as part of the line transect results. The species colours are co-ordinated between the diagrams and these charts. Comparison of the two illustrates the difference in the type of results obtained using line and belt transect methods. Most species will have an optimum zone within their range where the environmental conditions are best suited to their growth. In the diagrams below, this zone will be indicated by the area where the species reaches its maximum % cover. The percentage cover will often tail off gradually to either side of the optimum zone. None of the species below illustrate this pattern. This is because the bulk of the transect crossed the marsh zone. Environmental conditions, particularly in the marsh zone, are extremely variable locally, as are the water depths. The water depths marked were correct at the time of the survey but they will of course vary with the amount of water entering the wetland from rainfall and run-off. This means that there may be several optimum places for a species in a particular zone. This can make it difficult to pick out any particular pattern of distribution. However, it is clear from the charts that both Water Plantain and Greater Spearwort grow best where the water is deeper. Water Plantain is not very dominant (the red bars are short) and grows best in shallower water than the Spearwort. Wood Clubrush, Marsh Bedstraw and Water Mint are all distributed widely along the transect with little discernible pattern. They all die out as water depths begin to increase substantially. Wood Clubrush is the most dominant of the three (it has the tallest red bars), whereas Marsh Bedstraw is the least dominant (the shortest red bars). Yellow Iris has a somewhat narrower range, but has a similar dominance to Wood Clubrush. |
| East | West |
|
Greater Spearwort |
 |
|
Water Plantain |
|
|
Yellow Iris |
|
|
Wood Clubrush |
|
|
Marsh Bedstraw |
|
|
Water Mint |
|
|